
Solar, storage and hybrid plants for industry, with the switchboards built in our own works.
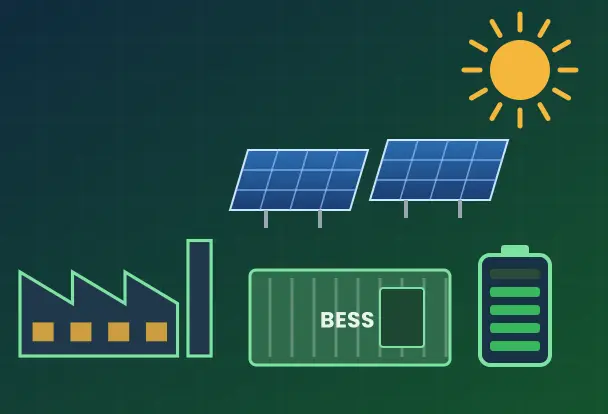

Free tool for HT industrial consumers
Electricity bill analyser
Type in the main figures from one month's HT bill and see your true landed cost per unit, how much of the bill is demand charge, your load factor, and an indicative saving from solar, storage and power-factor correction. Nothing is uploaded; the calculation runs in your browser.
This calculator needs JavaScript. If nothing appears below, enable JavaScript or send us your bill and we will run the numbers for you.
Enter units and total bill to begin. Add demand figures for the full analysis.
The headline numbers are free. The full breakdown, sizing and payback are emailed to you and unlocked here once you verify your work email.
One-time code to your email, nothing else. We do not share your details.
Your total bill divided by the units you used. It is always higher than the tariff rate printed on the bill, because demand charges, surcharges and duty are spread over the same units. This is the number to compare against captive solar at ₹2.5–3.5 a unit, not the tariff rate.
The DISCOM bills you for the highest kVA you drew in any half hour of the month, whether you used it for an hour or every day. On many industrial bills it is a quarter of the total. Storage that discharges during the peak lowers that figure every month, with no dependence on solar or weather.
Your average load divided by your maximum demand. A low load factor means short, sharp peaks, which is exactly the shape a battery is good at flattening. A high load factor means steady load, where solar does most of the work and storage is mainly for backup.
The feasibility study replaces all of these with a twelve-month load profile, your actual tariff schedule and a system sized to your plant.
Because demand charges, fuel surcharge, duty and taxes are spread over the same units. The tariff rate is only the energy line; the landed cost is what a unit actually costs you, and it is the number to compare against captive solar.
Units, total bill, maximum demand and demand charges. With those four the analyser gives landed cost, demand share and load factor, which between them say whether solar, storage or both fit your plant.
No. The calculation runs in your browser. Figures reach us only if you click through to the feasibility study, where they are placed in the form for you to review before sending.
Solar, storage and hybrid plants for industry, with the switchboards built in our own works.
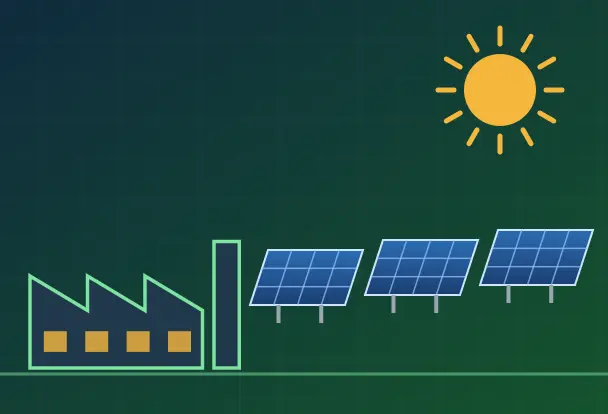
Captive rooftop and ground-mount solar with the electrical side engineered in-house.
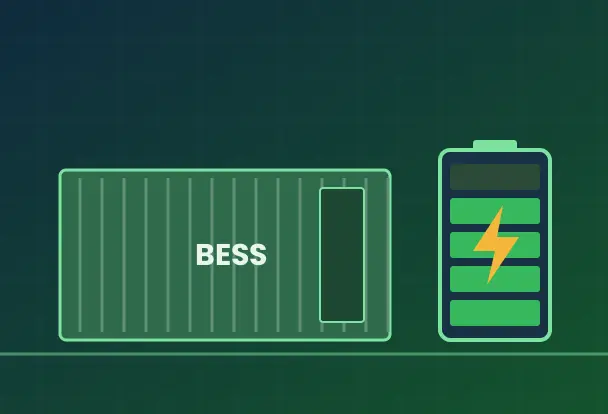
Storage that holds your plant up when the grid drops and trims demand charges.
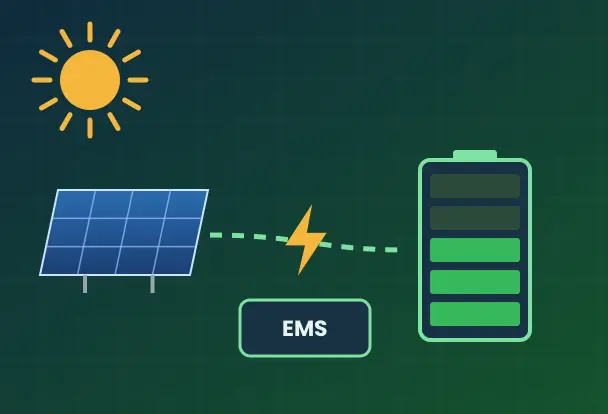
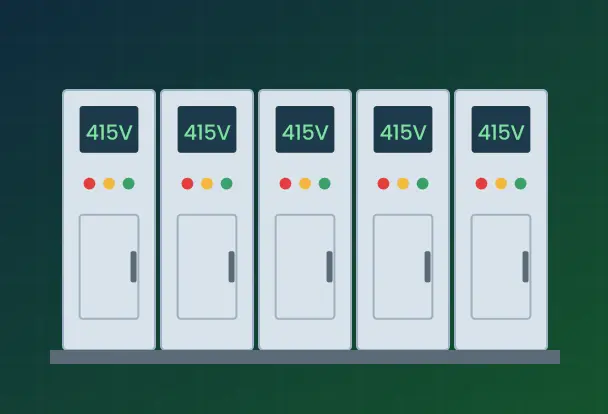
LT switchboards, ACDB, DCDB and protection built and tested in Vadodara.
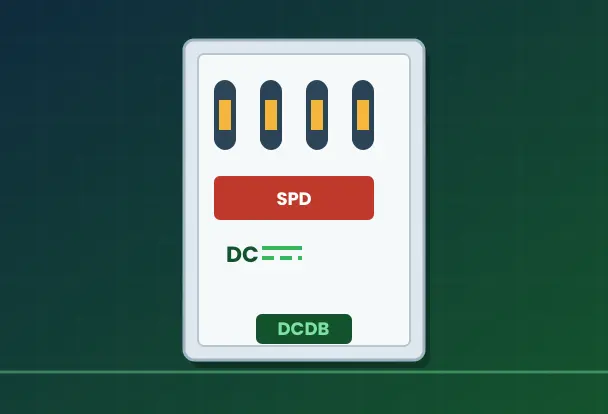
AC and DC distribution boards for solar plants, from our Vadodara works.